 .
.
REAS provides an option to group select attribute values into a combined line item while viewing results in the Report Output page. This grouping is defined on the report level and cannot be ported to another report. Once defined, you may reuse the base report and modify the additional attributes and metrics for the report.
Note: This grouping is defined on the report level and must be defined on each report you wish to include the grouping. You can save the report and the grouping will be part of the report definition.
Note: It is not recommended that you use this grouping option on percentage or weighted averages. This is primarily intended to be applied to count metrics within REAS.
· Overview of groups created on a report
· Steps to create a group while viewing results in the Report Output page
When viewing output in the Report Output page, you may combine multiple rows of data into a grouped line item. When selecting the rows, you are actually selecting the cells within the rows. The grouping is applied to those cell values and the break level is determined by the other attributes used for reporting dependent on the layout of the report and the position of the cells that are selected.
When you group rows of data from your output, the values in the individual rows are aggregated as follows:
Note: It is not recommended that you use this grouping option on percentage or weighted averages. This is primarily intended to be applied to count metrics within REAS.
Type of Metric |
Method of Aggregation |
Counts |
Summed into one total |
HPI/HPI Forecast Index |
Summed and then averaged by the count of summed values Note :Averages are NOT weighted |
Calculated Metrics (e.g., Percentages, Averages or Weighted Averages) |
Summed and then averaged by the count of summed values Note: Averages are NOT weighted |
The following are examples with an explanation on how the aggregation is processed:
· Cells with unique values that are not repeated when combined with other attributes on a report.
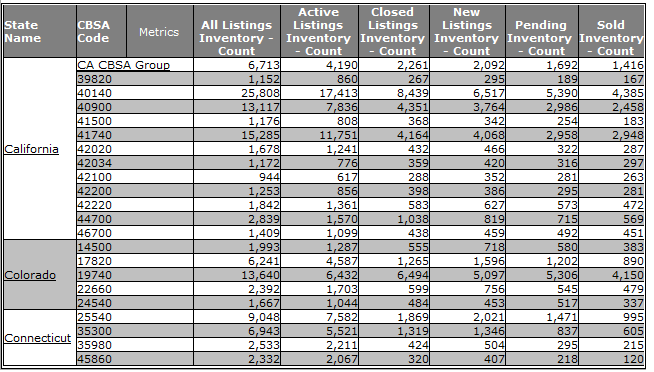
An example of this is the combination of the State and CBSA attributes on a report. The report will list each state and then the CBSA codes within that state. Typically, there is no duplication of a CBSA code across multiple states. When you group select CBSA codes within one state, the group is only applied to the state that the CBSA codes are linked to.
In this example, 5 of the CBSA codes for the state of California were selected to be grouped. Note that this group only appears in California as those selected CBSA codes are specific to California and not applicable for any other state.
 .
.
· Cells with values that are repeated when combined with other attributes on the report.
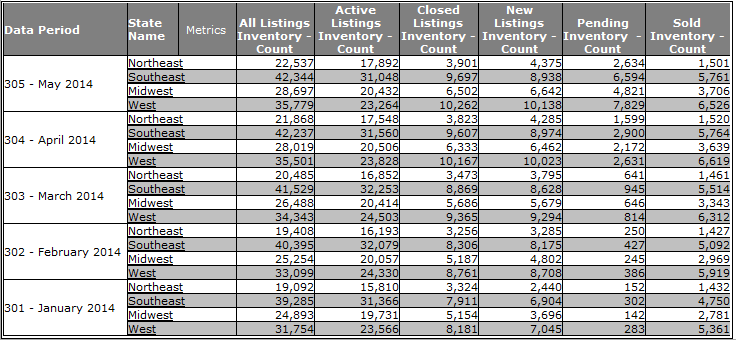
An example of this is the combination of the Data Period and State attributes on a report. Each state will report all data periods. The state values are repeated for each data period. When grouping select states, this group will appear for each data period.
The State Name and Data Period attributes are
included in the ListingTrends Counts by State report.
The State attribute is on the grid and the Data Period attribute is used
for the Page By.
Groups are defined on the State attribute for custom regions (e.g., Northeast,
Southeast, Midwest and West).
These region groups are applied to each Data Period value to provide aggregate
regional counts for each metric.
In this example, the states grouped by region are reported for each data period, so the output includes the grouping for each data period being reported..
Notice the row header for the original State attribute displays the original attribute name.

To create a group when viewing results in the Report Output page, follow the steps below:
Note: This step through uses the example above for quarterly reporting of ListingTrends counts by State from Jan 2011 through May 2014.
|
Run the ListingTrends Data by State report from Shared Reports. This is a prompted report. For this example, the prompt parameters are: (1) All States selected (excluding National) (2) Years 2011 through 2014 are selected (3) Counts for All Listings, Active Listings, Closed Listings, New Listings, Pending Inventory and Sold inventory are selected. |
|
|
Once the report has been generated, view the results in the Report Output page. For this example, we want group states into custom regions specific to company reporting standards (i.e., Northeast, Southeast, Midwest and West). To create a group to represent the four regions, you must create each region separately. The first region to create would be Northeast.
|
|
|
Select the cells whose values you wish to combine into one group. To select multiple cells, hold down your CTL key and click inside each cell for the states to be included in the group. Note: When clicking in a cell whose text is a hyperlink, be careful not to click on the hyperlink text, enlarge the cell by dragging the right border of the cell to ensure you can click in the cell without clicking the hyperlink. Note: A red "x" was added to the screenshot to identify the selected rows. |
|
|
Once all cells are selected for the region you are defining, right-click inside one of the selected cells to display the popup menu and select the Create Group option. |
|
|
Once you click the Create Group option, the Create Group dialog is presented. Enter the name of the group (for this first group example, type New England) and click the OK button. |
|
|
Once the OK button is clicked, the dialog is closed and the individual state rows are combined into one row with the group name you entered. Note, the original rows are no longer included in the detail of the report. If you were to enable totals for the report, the grouped line is included in the totals as the original detail line items are now reflected in the single group row. |
|
|
Repeat steps 3 through 6 for each region you wish to define. For this example, we will create 4 regions in total. |
|
|
Once your region groups are all defined, when you change the Data Period selected in the Page By, the groups are replicated for each Data Period value. In this example, the results are show with the Data Period in the Page By. |
|
|
In this example, the results are shown with the Data Period in the grid to demonstrate the group replicated for each data period. |
|