REAS
includes an option to define thresholds on one or more metrics in your
output to visually identify values for analysis. These thresholds allow
you to automatically modify the formatting of data or replace data with
symbols, images or alternate text when a cell of data reaches a specified
threshold.
In applying thresholds, you define the conditions for
the thresholds and the formatting or replacement text. When a cell of
data reaches the specified threshold, REAS
automatically applies the modifications to the data to visually identify
those cells that have reached the threshold conditions.
There are three types of thresholds you can define in
REAS as
follows:
· Quick Thresholds - defined
from the Thresholds button on the Data toolbar, these thresholds are based
on a predefined set of selectable options
· Standard Visual Thresholds
- defined from the Thresholds Editor dialog, these thresholds are
based on user defined breakpoints
· Advanced Visual Thresholds
- defined from the Advanced Thresholds Editor dialog, these thresholds
can combine conditions on several data objects to determine and apply
thresholds
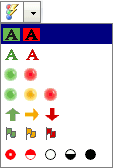
These thresholds are predefined conditions that are
applied via a drop down toolbar button on the Data toolbar ribbon. This
option does not allow you to define or customize the conditions for the
thresholds. The button is enabled when you have selected a metric from
your view of the output. The following thresholds are available for application:

|
Icon |
Thresholds
Type |

|
Applies background colors to top and
bottom 20% values of selected metric (2 threshold categories) |

|
Applies font colors to top and bottom
20% values of selected metric (2 threshold categories) |

|
Replaces metric value with green and
red circles for the top and bottom 20% values of selected metric
(2 threshold categories) |

|
Replaces metric value with green circle
for top 20%, yellow for middle 60% and red for bottom 20% (3 threshold
categories) |

|
Replaces metric value with green arrow
for top 20%, yellow for middle 60% and red for bottom 20% (3 threshold
categories) |

|
Replaces metric value with green flag
for top 20%, yellow for middle 60% and red for bottom 20% (3 threshold
categories) |

|
Replaces metric value with symbol
for each 20% incremental group of values of selected metric (5
threshold categories) |
A standard threshold represents conditional formatting
applied to a metric. These thresholds require you to define a set of breakpoints
that are applied to the value of the metric. When a cell containing the
metric reaches the defined threshold value, the cell is reformatted based
on the instructions in the threshold. There are five conditions that may
be defined:
· Highest
- this threshold requires you to define a numeric value used as a count
(e.g., highest 5)
· Lowest
- this threshold requires you to defined a numeric value used as a count
(e.g., lowest 5)
· Highest
% - this threshold requires you to define a numeric value used as a percentage
(e.g., highest 10%)
· Lowest
% - this threshold requires you to define a numeric value used as a percentage
(e.g., lowest 10%)
· Value
- this threshold requires you to define a numeric value to compare to
the value of the metric (e.g., 20,000)
You may define as many breakpoints within the threshold
setup as you wish. For example, you may choose to define breakpoint values
of 25%, 50% and 75%. Each
breakpoint has their own formatting setup applied to cells.
To define a standard threshold, you can either right
click the metric column header and select the Visual Thresholds option
or select the Visual Threshold option on the Data toolbar. The Visual
Threshold Editor panel is displayed. In the example
blow, when the 1 Month HPI change is either in the top 25% of the sample,
the numeric HPI value is formatted with bold green font and the bottom
25% is formatted with bold red font.

While the quick and the standard options for thresholds
only allow you to define conditions for the metric you wish to reformat,
the advanced thresholds allow you to define multiple conditions on any
attribute and/or metric combination as a basis for applying custom formatting
to one of the metrics in the output. There is no limit to the number of
conditions you may define for the threshold.
In addition to defining multiple conditions for one
threshold, you may define multiple thresholds for one metric. If you choose
to utilize this functionality for one metric, you should be careful not
to (a) duplicate threshold conditions across thresholds for one metric
and (b) define conflicting threshold formatting across thresholds for
one metric.
To define an advanced threshold, you must select a metric
from the drop down list and then define one or more conditions and the
formatting for the target metric.
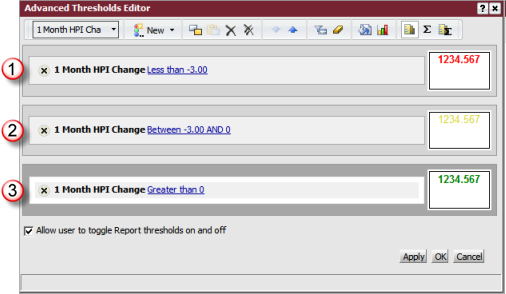
In the example below, there are three thresholds defined for the 1 Month
HPI Change metric; each threshold has one condition that, when the condition
evaluates as true, reformats the 1 Month HPI Change metric value to a
bold font with a color specific to the threshold that was met.
Note: The three thresholds are
mutually exclusive in that only one will be applied.
The value limits for each condition do not overlap and cover the entire
range of possible HPI change values, which makes each of these thresholds
mutually exclusive.


![]()
![]()
![]()
![]()
![]()
![]()
![]()

