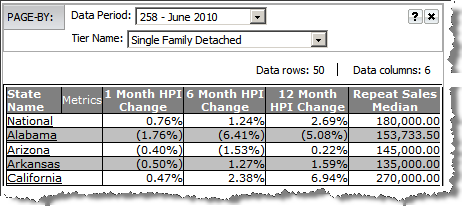
The Page By options for a report allow you to create
a set of pages based on the values of the attributes included in the Page
By setup. You can define the paging attributes when the report is created
or once you have generated the output. If you are adding an existing report
attribute to the Page By panel, the current output dataset is used. If
you adding a new attribute to the Page By panel, the report is regenerated
to add the specified attribute(s) to the output dataset and create pages
based on the values of the attribute.
In addition to using attributes in the Page By setup,
you may also use metrics. Since metrics represent one group of data elements
in the report setup, all metrics will be on the page by panel as a drop
down list with a label of Metric. The drop down list allows you to view
one metric at a time and the metrics are calculated based on the attribute
reporting bands.
Examples
of Page By using attributes
Examples
of Page By using metrics
The following is a visual diagram that illustrates pages
of data within your output dataset using attributes. The example assumes
you have Data
Period and HPI Tier defined for the Page By options on
a report.
In
this example, the historical Year and HPI Tier are used for the
Page By options. In the output, the HPI Tiers are SFD and SFA;
the historical HPI years are 2010 and 2009.
The report used is HPI by State.
The output dataset for HPI by
State will be presented in pages based on the combination of values
for HPI Tier and Year.
The combinations are as follows:
HPI Tier of SFD and Data Period
of May 2010
HPI Tier of SFA and Data Period
of May 2010
HPI Tier of SFD and Data Period
of June 2010
HPI Tier of SFA and Data Period
of June 2010

|

|
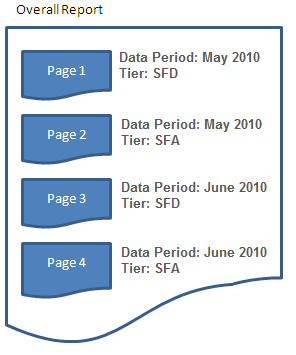
The following illustration demonstrates the example
above for creating pages by attribute values.
The overall report includes all HPI
values for all States that have a Tier value of SFD or SFA and
a Data Period of May or June 2010.
Each combination of values for HPI Tier
and historical Year comprise individual pages when the output
is viewed. As noted above, the attribute values for each page
would then be as follows:
State HPI with tier classification of
SFD for May 2010
State HPI with tier classification of
SFA for May 2010
State HPI with tier classification of
SFD for June 2010
State HPI with tier classification of
SFA for June 2010

|

|
You may place the report metrics on the Page By
setup to view metrics one at a time as separate pages of data. While not
common, defining metrics as pages may make your analysis easier to view
and produce a better view of the metric plot points.
Metrics are placed on a report as one entity; meaning
all metrics must be placed in the same report element (i.e., row header,
column header or Page By). When placed in the Page By panel, you will
see a single field labeled "Metrics" with a drop down list box
of each metric. You may only view one metric at a time based on the selection
in the Metrics Page By drop down.
This type of setup is best suited for graphed trend
output as it allows you to include multiple metrics in one output dataset
and limiting the view to one metric at a time eliminates the issue of
varying data values and scaling.
![]()

