REAS
provides an option to aggregate selected rows on a report into a calculated
line. When viewing report output, you select individual rows and specify
the calculation to perform (i.e., Add, Average, Least, Greatest) . When
you add a calculation, the calculated row is added to the view of the
report output and the original line items you selected remain displayed
(as opposed to the Create
Group on Report option which aggregates the grouped rows into one
and the original line items are removed).
Note: This calculation is defined on the report
level and must be defined on each report you wish to include the calculations.
You can save the report and the calculation will be part of the report
definition.
Note: It is not
recommended that you use these calculations on percentage or weighted
averages. This is primarily intended to be applied to count metrics within
REAS.
· Overview
of Create Calculation
· Steps to
add a calculation to a Report
Overview of Calculations Created on a Report Back
to Previous
When viewing output in the Report Output page, you may
combine multiple rows of data into calculation. When selecting the rows,
you are actually selecting the cells within the rows. The calculation
is applied to each metric on the rows associated with the selected cells
and the break level is determined by the other attributes used for reporting
dependent on the layout of the report and the position of the cells that
are selected.
When you add calculations to your report, the values
in the individual rows are aggregated as follows:
Note: It is not
recommended that you use these calculations on percentage or weighted
averages. This is primarily intended to be applied to count metrics within
REAS.
Type
of Metric |
Method
of Aggregation |
Add |
Each is summed by column. The type
of metric does not matter (e.g., counts, percentages, averages). |
Average |
Each metric is summed by column and
then averaged by the count of summed values.
Note :Averages are NOT weighted |
Least |
The smallest value for each metric
by column for the selected rows is displayed. |
Greatest |
The largest value for each metric
by column for the selected rows is displayed. |
Subtract |
For this option to be enabled,
you must select ONLY two cells. The value associated with the
second cell selected is subtracted from the value of the first
cell selected. |
Divide |
For this option to be enabled, you
must select ONLY two cells. The value associated with the first
cell selected is divided by the value from the second cell selected. |
Steps to Create a Calculation from Report Output Page Back
to Previous
To create a calculation when viewing report output
in the Report Output page, follow the steps below:

|
Run
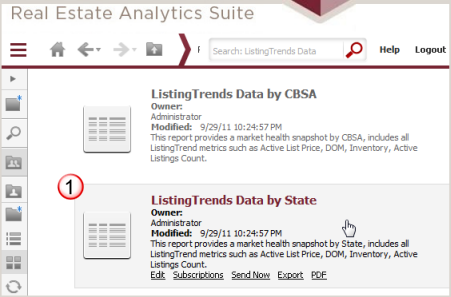
the ListingTrends Data by State report from Shared Reports.
This is a prompted report. For
this example, the prompt parameters are:
(1) All States selected (excluding
National)
(2) Years 2011 through 2014 are
selected
(3) Counts for All Listings, Active
Listings, Closed Listings, New Listings, Pending Inventory and
Sold inventory are selected. |
|

|
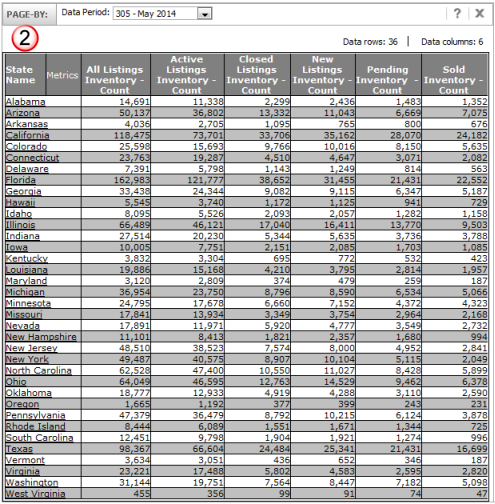
Once
the report has been generated, view the results in the Report
Output page. For this example, we want group states into custom
regions specific to company reporting standards (i.e., Northeast,
Southeast, Midwest and West).
To create a group to represent
the four regions, you must create each region separately. The
first region to create would be Northeast.

|
|

|
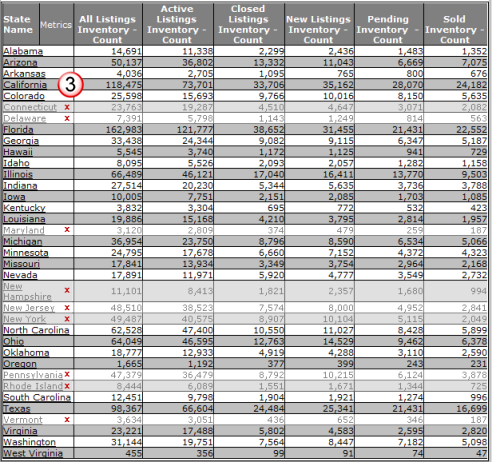
Select
the cells whose values you wish to aggregate in the calculation.
To select multiple cells, hold
down your CTL key and click inside each cell for the states to
be included in the group.
Note: When clicking in a
cell whose text is a hyperlink, be careful not to click on the
hyperlink text, enlarge the cell by dragging the right border
of the cell to ensure you can click in the cell without clicking
the hyperlink.
Note: A red "x"
was added to the screenshot to identify the selected rows. |
|

|
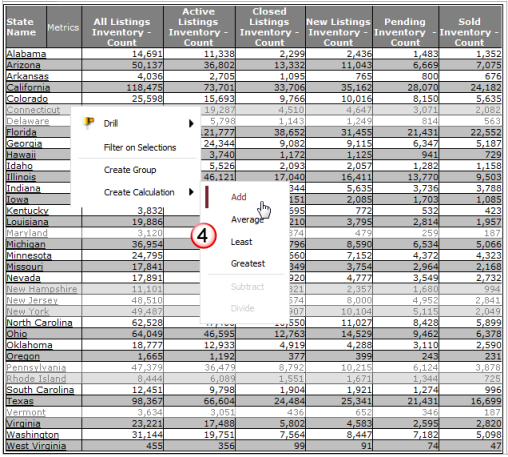
Once
all cells are selected for the region you are defining, right-click
inside one of the selected cells to display the popup menu and
select the Create Calculation option. |
|

|
Once
you click the Create Group option, the Create Group dialog is
presented. Enter the name of the group (for this first group example,
type New England) and click the OK button. |

|

|
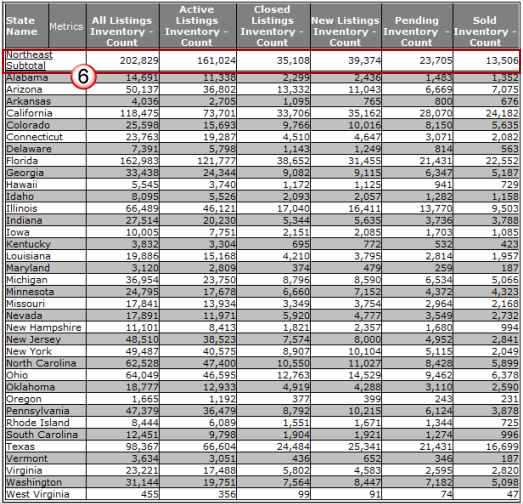
Once
the OK button is clicked, the dialog is closed and the individual
state rows are aggregated into the calculation row with the group
name you entered.
Note,
the original rows are still included in the detail of the report.
If you were to enable totals for the report, the original state
rows are included in the totals but the calculation line is not
included in the totals. |
|

|
Repeat
steps 3 through 6 for each calculation line you wish to add to
your report. |
|
![]()

![]()
![]()

![]()

![]()

![]()

![]()

![]()