REAS
provides predefined reports based on common analysis requests by our clients.
In addition to the predefined reports stored in Shared Reports, you also
have the option to create your own custom reports. You may create a report
in Design Mode from a blank template using the Create Report option, or
you may access an existing report in Design Mode to modify and save as
a new customized report.
To create a new report from a template, select the Create
Report option. If the application you are working in includes them, templates
will be listed along with a generic option for Blank Template. The blank
template will display the standard Design Mode with no selections (for
those applications that require a Data Period to be defined, there will
be a default Most Recent Data Period filter object selected for the Report
Filter).
To edit an existing report, select the Design Mode option
from the list of reports or, if viewing the report output, select the
Design Report icon on the toolbar.
Elements
of a Report
Design
Mode Overview
A report consists of the following elements:
Report
Filter - a set of conditions that is applied to the source data
to create the report output dataset. |
|
You
MUST have at least a Data Period filter condition to identify
one or more data periods for the report. |
Template
- the attributes and metrics for the output dataset and
layout. The template is comprised of three elements: |
|
Report
Attributes
The attributes used for metric calculations.
Each attribute has a predefined reporting band (e.g., LTV 10%
would provide reporting bands for metrics in increments of 10%;
0 to 10%, 10%+ to 20%, etc).
When you define multiple attributes,
the reporting bands are combined (e.g., combining the attributes
of Credit Score 50 points and LTV 10% would provide reporting
bands at each intersection; Credit Score 0 to 50 and LTV 0 to
10%, Credit Score 50 to 100 and LTV 0 to 10%, et al).
You must define AT LEAST ONE report
attribute. |
|
Report
Metrics
The measurements you wish to use for
analysis. You may include as many metrics for a report as needed.
The metrics are calculated for each reporting band based on the
attributes selected for the report.
You must define AT LEAST ONE metric
for reporting. |
|
Page
By Attributes
The attributes you wish to use to create
"pages" of data from your output dataset.
The pages will provide their own subtotals
and may be modified when viewing output once a report has been
run (which changes may also be saved to the report). Pages work
similar to the report attributes. The difference is that you may
create subsections of your output using the Page By.
When viewing report output, the Page
By panel displays each of the attributes as a drop down selection
list to specify the reporting bands you wish to view on the grid
or graph. You may only view one band per attribute (e.g., if LTV
10% was in the Page By, the drop down would have reporting band
selections of 10 to 10%, 10%+ to 20%, etc).
Page By setup is OPTIONAL and attributes
may be moved from the grid/graph to the Page By panel when viewing
report output. |
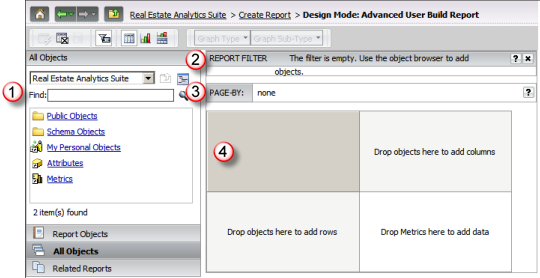
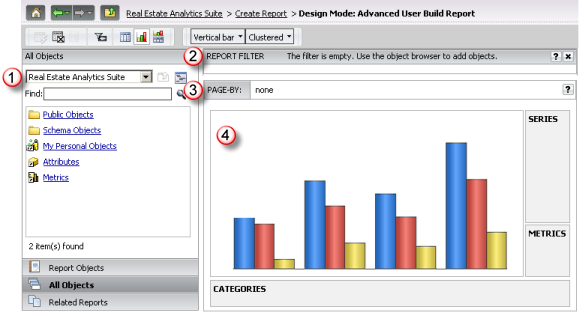
The following provides an overview of the Design
Mode view for Grid layout and Graph layout of a report with an explanation
of the components of the design layout. The Design Mode is used when creating
a new report or modifying the setup of an existing report.

|
Object
Browser
This panel provides access to search
for and select objects within REAS.
The browser allows you to view All Objects available for selection
or just the Report Objects defined for the report you are currently
working with.
The objects available for use with
reports include attributes, metrics and predefined filter objects
and may be used to build or customize your report.
Refer to the Object
Browser section for more information. |
Design
Mode for Grid Report

|

|
Report
Filter Panel
This panel allows you to define
the filter conditions that are applied to the source data to create
your output dataset. You define the conditions and how they relate
to one another.
Refer to the Filtering
Data section for more information.

|

|
Template
- Page By Panel
This panel allows you to define
the attributes that will comprise a page of data when viewing
the output dataset.
Attributes may be easily moved
from the grid or graph to the Page By. Refer to the Page
By section and Report
Template Layout section for more information. |
Design
Mode for Graph Report

|

|
Template
- Layout Panel
This panel defines the data elements
to be included in the output dataset and how the output is presented
once the report is executed. Your layout may be defined as a grid,
graph or a combination of grid and graph.
When defining a grid report, you
specify the data elements to be included in the rows and columns.
When defining a graph report, you specify the data elements to
be included in the categories (same as rows in grid layout) and
series (same as columns in grid layout) as well as a representation
of the type of graph selected (the graph type selection fields
are part of the toolbar above).
Refer to the Report
Template Layout section for more information. |
![]()

![]()
![]()
![]()

![]()